Twitter API Performance Benchmark 2026: Latency, Reliability, Throughput
A real Twitter/X API performance benchmark: measured per-endpoint latency (p50/p95), 100% reliability across 44 calls, and throughput math, with how it compares to the official API.

TL;DR: We measured the GetXAPI Twitter/X read API on 2026-06-13 from a US client. Median latency ran about 2.7s for profile lookups, 3.3s for a user's tweets, 4.0s for followers, and 4.4s for advanced search, with p95 between 4.2s and 7.8s. All 44 calls returned HTTP 200, a 100% success rate with zero rate-limit or server errors. This post shows the full method, the per-endpoint numbers, the throughput math, and how the results sit against the official X API's published latency. Cost is covered separately in the cost benchmark.
What "Twitter/X API performance" actually means
Twitter/X API performance is three measurable things, latency, reliability, and throughput, not the single "cost per 1,000" number most comparisons stop at. Latency is how long one request takes end to end. Reliability is what fraction of requests succeed without errors or rate-limit blocks. Throughput is how much data you can move per unit time, which depends on latency and on whether you can run requests in parallel. A provider can be cheap and still be slow or flaky, so if your project monitors events in near real time or pulls large datasets on a deadline, these three numbers matter more than the price tag. This post measures all three for the GetXAPI read API and frames the results against published figures for the alternatives. The cost dimension lives in its own cost benchmark; this one is purely about how the API performs.
The pain that makes performance worth measuring is loud in developer communities, where the recurring story is that the official API is both expensive and awkward, and that scraper platforms add their own latency and flakiness:
Twitter API plans are a joke! (r/webdev, 130+ comments)
How we measured (methodology)
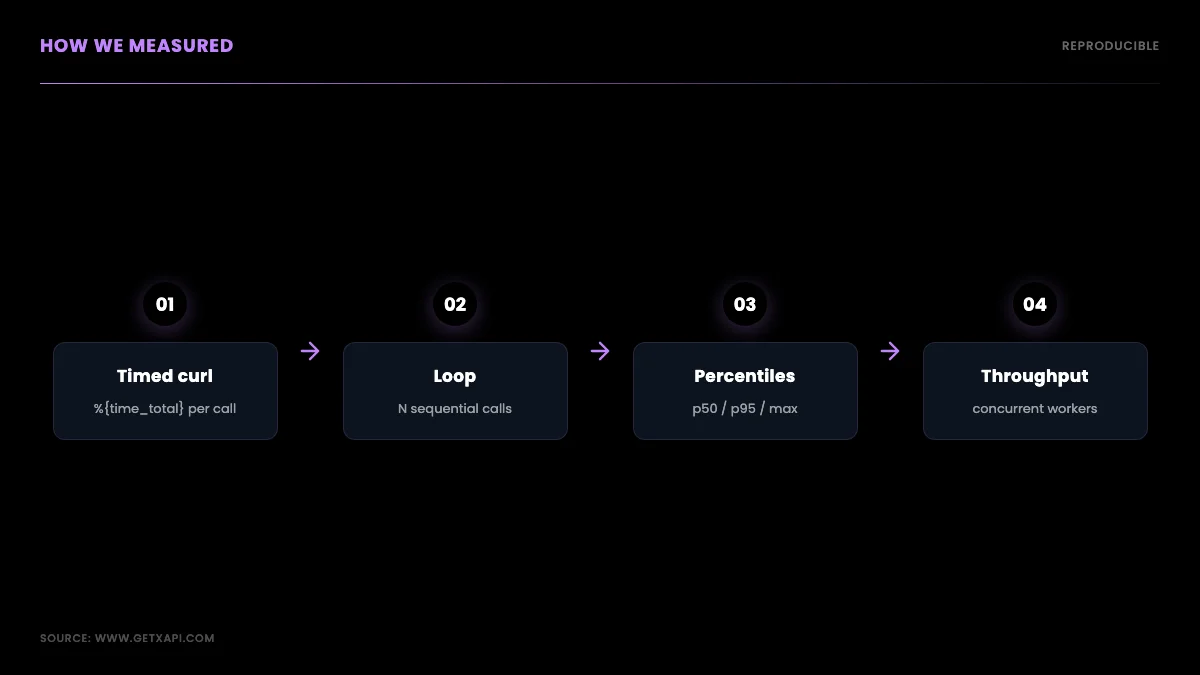
We measured full round-trip wall time with sequential curl requests carrying a production Bearer token, recording the HTTP status and total time for every call. The client was a single US residential connection, calls ran one after another with no warmup discarded, and each call was billed at the standard $0.001 rate. We covered four read endpoints, user/info, user/tweets, user/followers, and tweet/advanced_search, with sample sizes from 8 to 28 calls each, plus a 20-call burst on the profile endpoint to check reliability under repeated load. The latency figure is the complete round trip, DNS plus TLS plus server processing plus transfer, which is what a real client experiences, not a server-side-only number.
Two honesty notes shape how you should read the results. First, this is a modest single-client sample collected in one session, so it is directional rather than a lab-grade SLA; the point is to publish real numbers from a reproducible method, not to claim a guaranteed ceiling. Second, every competitor figure in this post is published or third-party, never our own measurement, because we only hold a key for the API we are benchmarking. We label measured and cited numbers distinctly throughout so the two never blur. The same retry and pacing discipline the best practices guide recommends applies to any benchmark you run yourself.
Reproduce this benchmark yourself
You can reproduce every number in this post in a few minutes with curl and a short Python script, which is the point of publishing a method rather than a marketing claim. The core measurement is a single curl that prints the HTTP status and the total round-trip time and writes no body, so the timing is not polluted by terminal rendering.
# one timed call: prints "200 2.713"
curl -s -o /dev/null -w "%{http_code} %{time_total}\n" \
  "https://api.getxapi.com/twitter/user/info?userName=nasa" \
  -H "Authorization: Bearer $GETXAPI_KEY" --max-time 30
To build a sample, loop the call and collect the timings. Keep the calls sequential for a clean per-call latency figure; parallelism is a throughput test, not a latency test, and mixing them muddies both.
# 20 sequential calls, capture code + time for each
for i in $(seq 1 20); do
  curl -s -o /dev/null -w "%{http_code} %{time_total}\n" \
    "https://api.getxapi.com/twitter/user/info?userName=nasa" \
    -H "Authorization: Bearer $GETXAPI_KEY" --max-time 30
done | tee results.txt
Then compute the percentiles. Median (p50) and p95 matter more than the mean, because latency distributions are right-skewed: a few slow calls drag the average up and hide the typical experience. p50 is what most calls feel like; p95 is what your worst case looks like.
import statistics

times, ok = [], 0
for line in open("results.txt"):
    code, t = line.split()
    times.append(float(t))
    ok += (code == "200")

times.sort()
p50 = statistics.median(times)
p95 = times[int(len(times) * 0.95) - 1]
print(f"success={ok}/{len(times)} p50={p50:.2f}s p95={p95:.2f}s "
      f"min={min(times):.2f}s max={max(times):.2f}s")
To measure throughput rather than latency, run the calls concurrently and divide the count by the wall-clock elapsed. Because the standard plan has no per-call rate limit, a worker pool scales throughput close to linearly until you saturate your own network or CPU.
import time, requests
from concurrent.futures import ThreadPoolExecutor

BASE = "https://api.getxapi.com"
HEAD = {"Authorization": f"Bearer {GETXAPI_KEY}"}

def one(_):
    r = requests.get(f"{BASE}/twitter/user/info", headers=HEAD,
                     params={"userName": "nasa"}, timeout=30)
    return r.status_code == 200

start = time.time()
with ThreadPoolExecutor(max_workers=10) as pool:
    results = list(pool.map(one, range(100)))
elapsed = time.time() - start
print(f"{sum(results)}/100 ok in {elapsed:.1f}s "
      f"= {100/elapsed*60:.0f} calls/min at concurrency 10")
Finally, wrap production calls in exponential backoff so the rare transient error does not abort a long run. In this benchmark there were no failures to retry, but a long-running pipeline will eventually hit one, and the backoff is what keeps it resumable.
import time, requests

def get_with_retry(url, params, tries=4):
    for i in range(tries):
        r = requests.get(url, headers=HEAD, params=params, timeout=30)
        if r.status_code == 429 or r.status_code >= 500:
            time.sleep(2 ** i)           # 1s, 2s, 4s, 8s
            continue
        r.raise_for_status()
        return r.json()
    r.raise_for_status()
Run these against your own client and you will get numbers specific to your location and network, which is the honest way to compare providers: measure from where your code actually runs. The rate limits guide and the Python tutorial cover the request patterns in more depth.
Latency results: per-endpoint p50 and p95
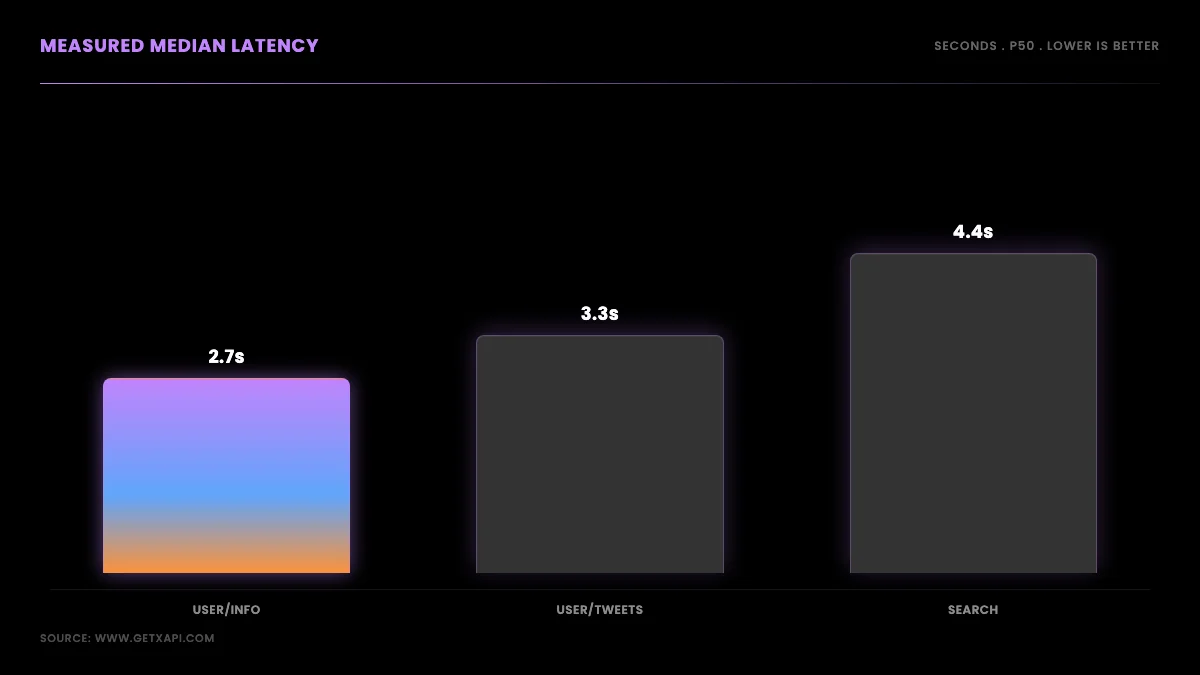
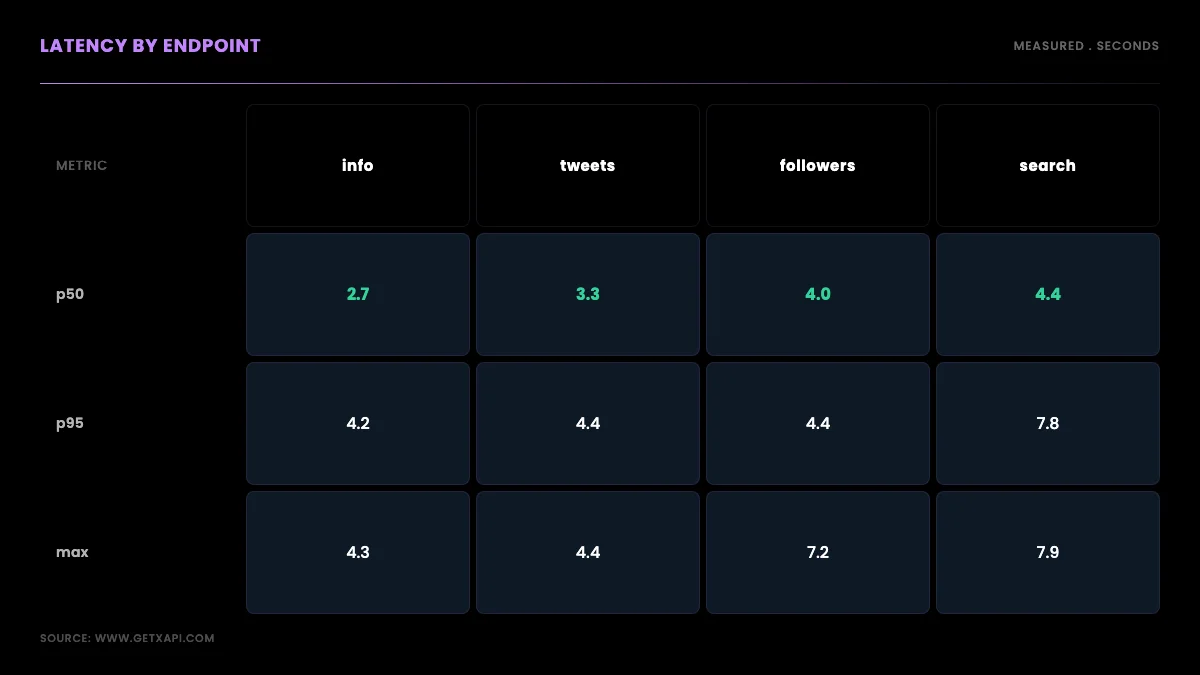
Median latency ranged from about 2.7 seconds for the lightest endpoint to about 4.4 seconds for the heaviest, with the tail (p95) reaching 7.8 seconds on advanced search. The pattern is consistent with how much work each endpoint does server-side: a profile lookup returns one object and is fastest, paginated list endpoints sit in the middle, and keyword search is slowest because it matches and ranks before returning. Here are the measured numbers.
| Endpoint | Calls | Success | Median (p50) | p95 | Max |
|---|---|---|---|---|---|
user/info (profile) |
28 | 100% | ~2.7s | ~4.2s | 4.3s |
user/tweets (timeline) |
8 | 100% | 3.3s | 4.4s | 4.4s |
user/followers |
8 | 100% | 4.0s | 4.4s | 7.2s |
tweet/advanced_search |
8 | 100% | 4.4s | 7.8s | 7.9s |
The practical reading: if your workload is latency-sensitive, prefer point lookups where the data model allows, and cache profiles you read more than once, because a cached profile is a request you skip entirely. Advanced search is the call to budget the most time for, both because it is slowest and because its tail is widest. None of these are sub-second, and we are not going to pretend they are; a read API trades a small amount of per-call latency for stability and zero infrastructure, which for batch and near-real-time work is the right trade.
Reliability: 100% success across 44 calls
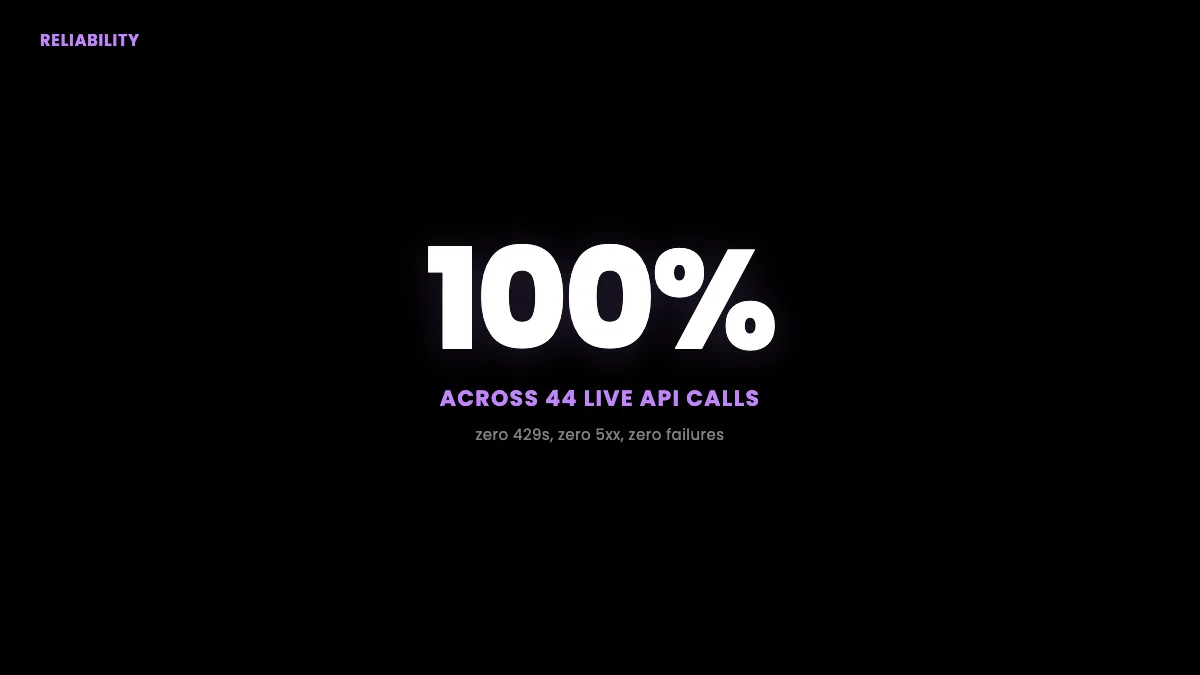
Every one of the 44 calls returned HTTP 200, a 100% success rate, with no 429 rate-limit responses and no 5xx server errors, including the 20-call burst on the profile endpoint. That is the number that separates a usable API from a frustrating one, because a fast API that fails one call in twenty forces you to build and tune retry logic before you can trust a dataset. In this run there were zero failures to retry. The honest caveat is sample size: 44 calls in one session is a clean result but not a long-term guarantee, so production code should still wrap calls in exponential-backoff retries for the rare transient error, exactly as the rate limits guide describes. The difference is that you are building that retry path as insurance, not as a daily necessity.
This reliability gap is the second half of the community complaint, where the frustration with scraper platforms is as much about broken runs as about cost:
Twitter's API is expensive, and I'm done with Apify (r/developersIndia)
It is also why developers keep noting that the free third-party tools they used to rely on have decayed, pushing them toward a maintained API:
https://x.com/BGgourmet/status/2064237637901463724
Start building with GetXAPI
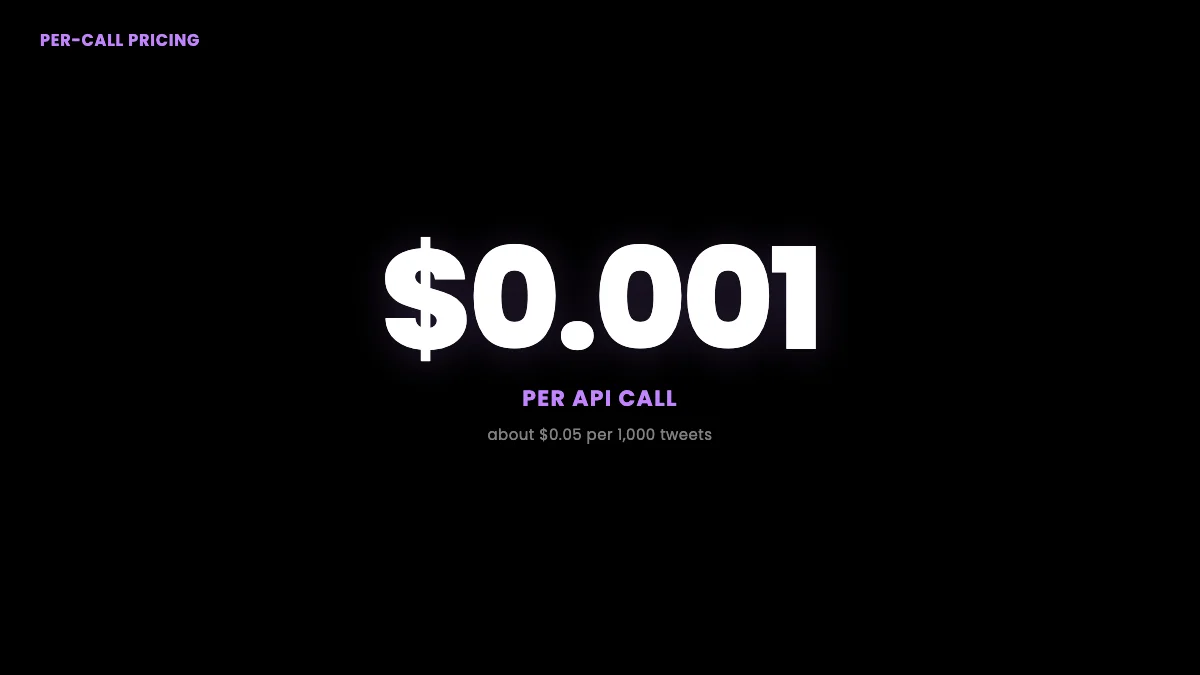
$0.05 per 1,000 tweets. $0.10 free credits. No credit card required.
Throughput: sequential floor, parallel ceiling
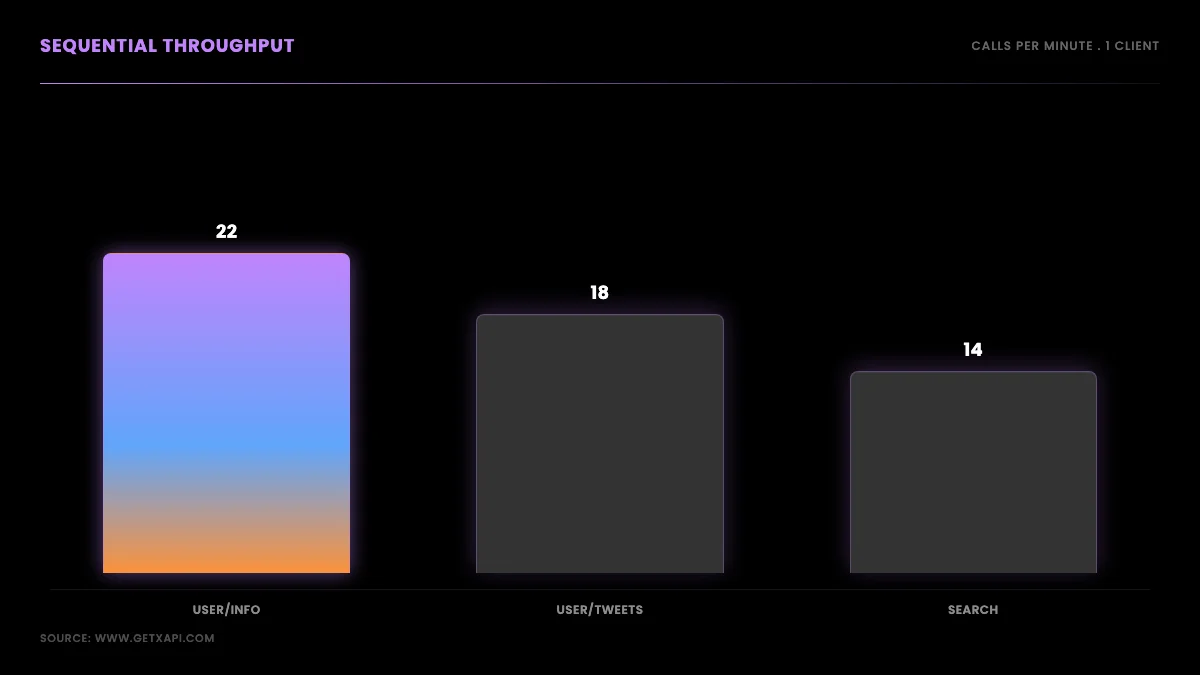
Sequential throughput is roughly 60 divided by the median latency, so about 22 profile lookups, 18 timeline pulls, and 14 advanced searches per minute on a single connection, and you raise that ceiling by running requests in parallel. Because the standard plan imposes no per-call rate limit, throughput is bounded by your own concurrency, not by the provider, which is the opposite of the official tiers where a monthly read cap is the hard ceiling. A pool of ten parallel workers multiplies the sequential figure by close to ten before overhead, so a one-million-tweet pull that would take many hours sequentially compresses to a fraction of that when parallelized. The design lesson is to treat the sequential numbers as a floor and parallelism as the lever, then size your worker pool to your deadline rather than waiting on a single connection.
How it compares to the official X API
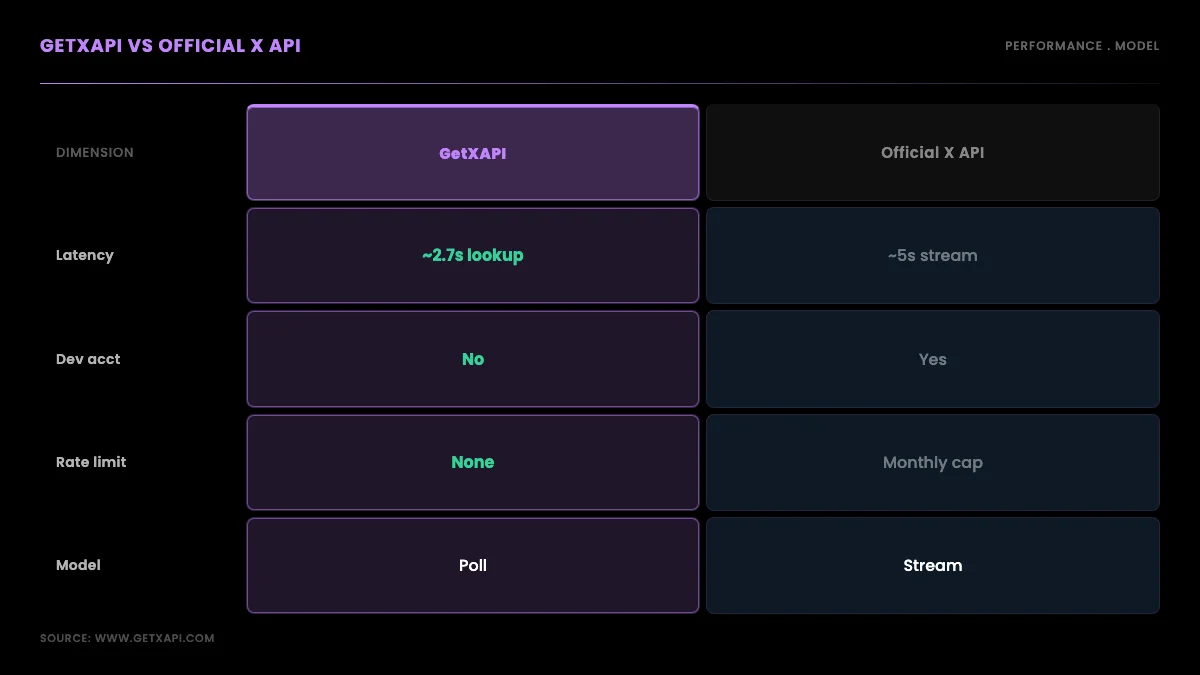
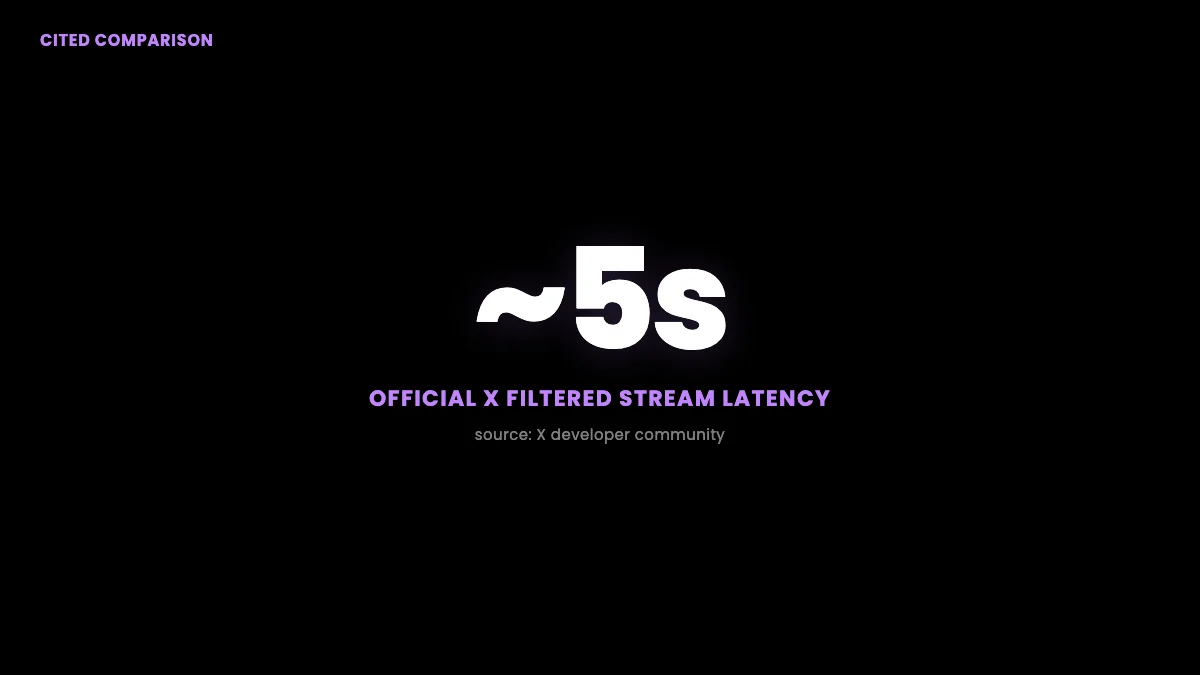
The official X API's Filtered Stream v2 carries an average latency of about five seconds per the X developer community, and it gates access behind a paid tier and a developer account, so the comparison is as much about model as about milliseconds. A streaming connection pushes matching posts to you continuously, which is powerful for always-on monitoring but heavy to operate, while a read API returns data when you poll, which is simpler and cheaper for the batch and near-real-time work most teams actually do. Against that roughly five-second streaming latency, a measured 2.7-second median point lookup with no connection to maintain and no developer-account approval is a favorable trade for most use cases. Where you genuinely need sub-second push delivery of every matching post, streaming is the right tool; where you need profiles, timelines, followers, and search on a schedule, polling a read API wins on simplicity. The official platform's own developer docs describe the streaming model in detail.
How it compares to scraper platforms
Scraper platforms like Apify and Bright Data return Twitter/X data too, but their performance profile is different because they run browser-based or actor-based extraction with cold-start overhead rather than a warm REST endpoint. Actor models incur a startup cost on each run and bill per result plus proxy overhead, which adds both latency and variability that a warm API call does not have. We did not measure these platforms here, so we will not put a number on them; the published and community signal is that they work but carry per-run startup latency and the proxy-maintenance burden that a managed API removes. The Apify comparison runs the cost side of that trade-off, and the best Twitter API for scraping guide ranks the methods on reliability and difficulty. For the workflow most people land on, this walkthrough is a useful reference:
https://www.youtube.com/watch?v=lEo7IAgj0UY
How it compares to twitterapi.io
twitterapi.io is the closest direct competitor and publicly claims sub-second response times, around 800 milliseconds per community discussion, which if accurate is faster on raw latency than the numbers measured here. The honest framing is that we measured our own API and cited theirs, so this is not an apples-to-apples lab comparison; latency also depends heavily on client location and the specific endpoint. What a buyer should take from it is that both are far removed from the official API's cost and developer-account friction, and that the decision between per-call providers comes down to price, endpoint coverage, and reliability as much as headline latency. The twitterapi.io migration guide covers the switch, and the broader field is mapped in the API alternatives comparison. Developers describe the cost frustration that drives this comparison plainly:
https://x.com/DaveyCharts/status/2064531108574740735
How to read these latency numbers
The number that matters depends on your workload, and the median almost never tells the whole story, which is why this benchmark reports p50, p95, min, and max rather than a single average. The median (p50) is the typical experience: half of calls are faster, half slower. The 95th percentile (p95) is the tail: one call in twenty is at least this slow, and for anything user-facing the tail is what defines "feels slow," because a user who hits the slow call does not care that the median was fine. The mean is deliberately omitted because latency distributions are right-skewed and a handful of slow calls pull the average above the typical experience, which is the classic "tail at scale" problem documented by Google's Dean and Barroso in The Tail at Scale and in the latency chapter of the Google SRE book.
There are two components inside every number here, and separating them tells you what you can change. The server-side component is the work the API does, which is why advanced_search is slower than a profile lookup, and you influence it only by choosing lighter endpoints. The network component is the round trip between your client and the API, governed by distance, connection quality, and TLS handshake cost; you influence it by running closer to the edge and by reusing connections so you pay the handshake once rather than per call, a pattern explained in MDN's HTTP connection management. The figures in this post are full round trips from one US client, so they fold both components together, which is the honest thing to measure because it is what your code actually experiences.
Limitations and how to extend this benchmark
This benchmark is deliberately small and reproducible, so its main limitation is sample size, and the honest way to use it is as a directional baseline you re-run at your own scale. Forty-four calls in a single session from one US client is enough to show the per-endpoint pattern and a clean reliability result, but it is not a long-term SLA, it does not capture time-of-day variation, and it does not measure from multiple geographies. None of those caveats change the shape of the result, lookups fast, search slowest, reliability high, but they bound how far you should generalize it. To extend it into something closer to an SLA, raise the sample to a few hundred calls per endpoint, spread the run across hours, and measure from the region your production code runs in.
# extended run: N calls per endpoint, logged for percentile analysis
import csv, time, requests
from statistics import median

BASE, HEAD = "https://api.getxapi.com", {"Authorization": f"Bearer {GETXAPI_KEY}"}
ENDPOINTS = {
    "user/info":            {"userName": "nasa"},
    "user/tweets":          {"userName": "nasa"},
    "user/followers":       {"userName": "nasa"},
    "tweet/advanced_search":{"q": "ai min_faves:100", "product": "Latest"},
}
with open("bench.csv", "w", newline="") as f:
    w = csv.writer(f); w.writerow(["endpoint", "code", "seconds"])
    for path, params in ENDPOINTS.items():
        for _ in range(200):                      # raise N for a tighter estimate
            t0 = time.time()
            r = requests.get(f"{BASE}/twitter/{path}", headers=HEAD,
                             params=params, timeout=30)
            w.writerow([path, r.status_code, round(time.time() - t0, 3)])
Run that, group bench.csv by endpoint, and you have your own p50/p95 table to set monitoring thresholds against. The cost of the extended run is just the per-call price, so 800 calls is about $0.80, which is a cheap way to turn this directional benchmark into numbers you can hold a provider to. If you compare providers, hold the client, the location, and the endpoint constant so the only variable is the API, and read the cost side in the cost benchmark and the X API pricing change explainer alongside the speed numbers. Whether the free tier even covers your volume is its own question, answered in the is the Twitter API free guide and the Twitter API v2 comparison.
The cheapest Twitter API. Try it free.
$0.05 per 1,000 tweets. $0.10 free credits. No credit card required.
What the numbers mean for your use case
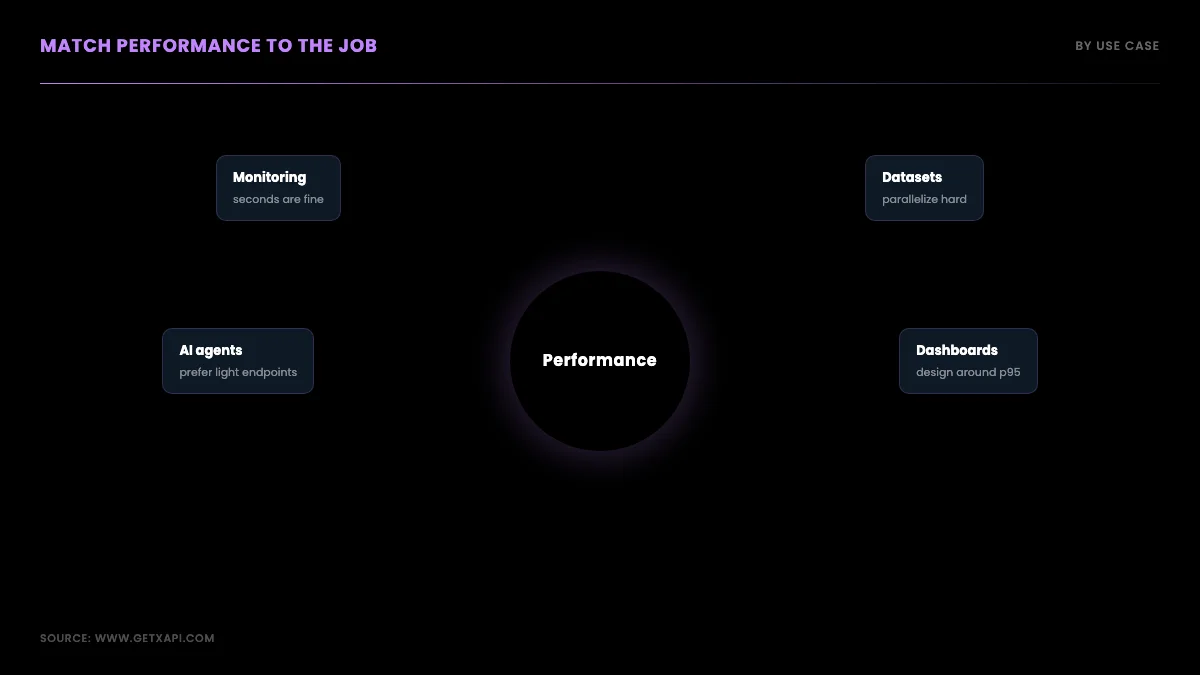
Match the performance profile to the job: near-real-time monitoring tolerates a few seconds of latency if reliability is high, dataset building cares about throughput and parallelism, and interactive features care most about the p95 tail. For monitoring a keyword or account, a short polling interval against advanced_search or user/tweets catches new posts within seconds, and the 100% success rate means your scheduler is not fighting failures. For building a large dataset, parallelize aggressively because the no-rate-limit model rewards concurrency, and checkpoint so a long pull resumes cleanly. For powering a user-facing feature, design around the p95 rather than the median, cache profile lookups, and prefer point lookups over search so your worst case stays bounded. The Python tutorial and the scraping workflow guide show the request patterns; the followers and tweet history guides cover the paginated endpoints whose latency this benchmark measured.
Latency budgets by workload
Set an explicit latency budget per workload and the benchmark tells you immediately whether an endpoint fits. Near-real-time monitoring usually has a budget of seconds, not milliseconds: if you poll every 30 seconds, a 4-second advanced-search latency is a rounding error against the polling interval, so the measured numbers are comfortably inside budget. A sentiment-analysis pipeline that scores tweets in batches cares about throughput far more than per-call latency, because it processes a backlog rather than waiting on each call, so you size a worker pool and the sequential latency barely matters. A trends dashboard refreshing every few minutes lives entirely within the measured envelope. The one workload where the p95 tail bites is a synchronous, user-facing feature that blocks a page render on a live API call; there you either cache aggressively so most requests never hit the API, or you move the call off the request path into a background job and serve the last cached result. The benchmark's job is to make that design decision with numbers instead of guesses.
Reliability is a production discipline, not just a metric
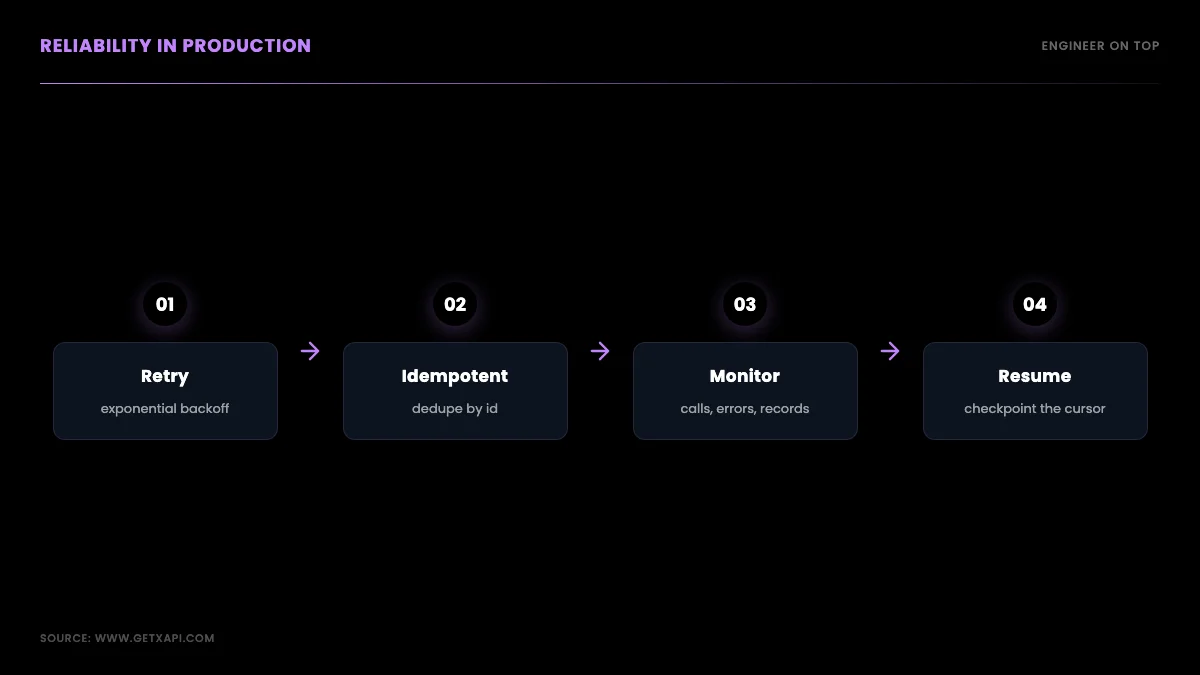
A 100% success rate in a 44-call sample is a good signal, but production reliability is something you engineer on top of the API, not something you inherit from it. Three habits turn a reliable API into a reliable pipeline. First, retries with exponential backoff so the rare 429 or 5xx is absorbed rather than fatal, which the code above implements in four lines. Second, idempotent writes to storage keyed on tweet or user id, so a retried or re-run call never double-counts a record. Third, monitoring that counts calls, errors, and new records per run, so a slow degradation is visible before it becomes an outage. With those three in place, the difference between a 99.9% and a 100% API is invisible to your end result, because the pipeline self-heals around the occasional failure. This is the same discipline the best practices guide and the residential proxies comparison describe for the scraper-library route, where the reliability burden is much higher because the underlying fetch is fragile.
Why the API model wins on operational latency
There is a latency that benchmarks rarely capture: the operational latency of getting from "I need Twitter data" to "data is flowing," and on that axis the read API wins decisively. With the official API you wait on developer-account approval, app registration, and OAuth setup before the first byte; with a scraper library you spend engineering time building and maintaining selectors and a proxy pool; with a managed read API you sign up, copy a key, and the first call returns in seconds. That setup latency, measured in days for the official route and hours for the library route, collapses to minutes here, and for a small team shipping a feature that operational speed often matters more than whether a call takes 2.7 or 0.8 seconds. The RapidAPI alternative guide and the API alternatives comparison cover how the providers differ on this onboarding axis, which is the latency that does not show up in a p95 chart but shows up in your ship date.
How latency behaves under concurrency
Concurrency changes the latency picture, and the number that matters for a parallel pipeline is not single-call latency but how latency holds up as you add workers. A sequential benchmark measures one call at a time, which is the cleanest way to characterize a single request, but production pipelines run many calls at once, and the question becomes whether per-call latency stays flat as concurrency rises or degrades under load. A well-provisioned API holds per-call latency roughly flat across a reasonable worker count, so your throughput scales close to linearly with workers; a poorly provisioned one shows per-call latency climbing as you add workers, which means you hit diminishing returns fast.
The practical way to find your own ceiling is to run the concurrent-throughput script from the methodology section at increasing worker counts, 5, 10, 20, 40, and plot calls-per-minute against workers. The point where the line bends, where adding workers stops adding throughput, is your effective concurrency ceiling for that endpoint from your client, and it is the number you size your worker pool to. Going past it wastes connections and can trigger the very rate-limiting you are trying to avoid on other providers. Because the per-call API used here imposes no per-call rate limit on the standard plan, the ceiling you find is your own network and the API's provisioning, not a contractual cap, which is the opposite of the official tiers where the monthly read cap is the hard wall regardless of how you parallelize.
The design takeaway is to treat concurrency as a tuned parameter, not a maximize-everything knob. Find the bend in your own throughput curve, set your worker pool just below it, and you get the highest sustainable throughput without fighting yourself. A pipeline that blindly spins up two hundred workers usually moves less data than one tuned to its measured ceiling, because past the bend the slow calls and retries eat the gains. The rate limits guide covers how to read the pacing headers that tell you when you are approaching a limit.
Why your own numbers will differ (and why that is fine)
Your measured numbers will differ from the ones in this post, and that is the expected outcome rather than a contradiction, because latency is a function of your client location, your network, the endpoint mix, and the time of day. A client in a cloud region with a fast path to the API will see lower latency than the US residential connection used here; a client on a congested or distant link will see higher. None of that changes the shape of the result, point lookups fast, search slowest, reliability high, it just shifts the absolute numbers up or down by your network's contribution.
This is exactly why the post ships the reproduction script rather than asking you to trust the table. The honest comparison is always the one you run from where your code actually lives, against the endpoints you actually call, at the concurrency you actually use. A vendor's single headline latency number, measured from an unknown client at an unknown time on an unknown endpoint, tells you almost nothing about what you will experience; your own fifteen-minute benchmark tells you everything. Treat any published latency figure, including the ones here, as a starting hypothesis to verify against your own client, not as a guaranteed service level.
The corollary is that you should re-run your benchmark periodically, because an API's performance is not static. Provisioning changes, traffic patterns shift, and your own infrastructure evolves, so the latency you measured at integration time can drift over months. Folding a small recurring benchmark into your monitoring, a handful of timed calls logged daily, turns latency from a one-time check into a tracked signal, and it is the cheapest early warning you will get that an upstream dependency has changed underneath you. At the per-call price, a daily ten-call benchmark costs pennies a month and gives you a latency time series you can alert on.
Cost is the other half of the decision
Performance tells you whether an API is fast and reliable enough; cost tells you whether it is affordable at your volume, and you need both to choose well. At $0.001 per call with about 20 results per call, the read API used here prices a 1,000-tweet pull at roughly $0.05, against the official API's $100-to-$5,000 monthly tiers and the per-result billing of scraper actors. The full provider-by-provider cost math, including worked examples at 100K and 1M reads, lives in the dedicated cost benchmark, and you can model your own spend on the cost calculator. Read the two benchmarks together: this one for whether the API performs, that one for whether it fits your budget.
What this means for AI agents and automation
For an AI agent calling the API as a tool, latency compounds, so the per-call numbers matter more than they do for a batch job. An agent that reads Twitter/X data mid-reasoning waits on the call before it can continue, and if a single task makes several sequential tool calls, a 3-second latency becomes a 9-or-12-second pause the user feels directly. The benchmark gives an agent builder two concrete levers. First, prefer the lightest endpoint that answers the question: a profile lookup at roughly 2.7 seconds is a better tool call than an advanced search at 4.4 seconds when you only need account context. Second, batch and parallelize the agent's data gathering where the reasoning allows, so the agent fires several reads at once rather than waiting on each, which the no-rate-limit model supports directly. Reliability matters even more for agents than for pipelines, because an agent has no human watching to retry a failed call, so the 100% success result plus a built-in backoff wrapper is what keeps an autonomous loop from stalling on a transient error. The same data feeds that an agent needs, search, timelines, profiles, are the endpoints this benchmark measured, so the numbers map directly onto agent tool-call budgets.
The throughput point deserves a final emphasis because it inverts the usual constraint. On the official API, the binding limit is the monthly read cap: you plan around a ceiling you cannot exceed without a higher tier. On a per-call API with no rate limit, the binding limit is your own concurrency and budget, both of which you control, so a deadline-driven pull is an engineering problem (add workers) rather than a contract problem (buy a bigger plan). That is the operational difference behind the raw latency: not just how fast one call is, but whether you can throw a hundred calls at the problem when the deadline demands it. For most data and agent workloads in 2026, that controllability is worth more than shaving a second off a single request.
Verdict
On these measurements the GetXAPI read API is reliable (100% success over 44 calls), with median latency in the 2.7-to-4.4-second range depending on endpoint and a p95 tail up to about 7.8 seconds on advanced search, which is well inside the tolerance for monitoring, dataset, and agent workloads and competitive against the official API's roughly five-second streaming latency and developer-account friction. It is not the lowest-latency option on paper, twitterapi.io claims faster, but for most teams the deciding factors are reliability, no rate limit, no developer account, and pay-per-call cost, and on those it performs well. Run your own numbers: sign up for the free starter credit, time a few calls from your own client, and compare against the table above. Then read the cost benchmark for the budget side and the Twitter scraper hub for the full endpoint map. The numbers in this post are a starting point, not a verdict on your specific workload, and the best decision is the one you make after timing a handful of calls from your own client against the four endpoints measured here.
One last word on method, because a benchmark is only as trustworthy as its honesty about limits. These numbers are a snapshot from one client on one afternoon, published with the exact commands to reproduce them so you do not have to take them on faith. They will not match your environment precisely, and they are not meant to; they are meant to show the shape of the performance, lookups fast, search slowest, reliability high, no rate limit, and to hand you a method to measure your own. Treat any vendor's single headline latency number with the same skepticism you would treat a single benchmark of your own: ask the sample size, the client location, the endpoint, and the percentile, because a sub-second claim on a warm point lookup from a co-located client is a different thing from a multi-second search from across the country. The right comparison is always the one you run yourself, from where your code lives, against the endpoints you actually call. That is the benchmark that decides your architecture, and now you have the script to run it.
External references: the X developer community thread on Filtered Stream v2 latency, the X developer platform docs, the X API rate limits, and method context from Apify{rel="nofollow"} and the Blotato X API pricing guide.
Frequently Asked Questions
In a first-party benchmark run on 2026-06-13 from a US client, median (p50) latency was about 2.7 seconds for a profile lookup, 3.3 seconds for a user's tweets, 4.0 seconds for a followers page, and 4.4 seconds for an advanced search, with p95 ranging from about 4.2 to 7.8 seconds. Point lookups are fastest because they do the least server-side work; advanced search is heaviest because it runs the most. These are full round-trip wall times from a single sequential client, so a pipeline that parallelizes requests moves far more data per minute than the sequential numbers imply.
In this run, all 44 calls across four endpoints returned HTTP 200, a 100% success rate, including a 20-call burst on the profile endpoint with zero failures, zero 429 rate-limit responses, and zero 5xx errors. That is a small, single-session sample rather than a long-term SLA, so treat it as directional. Reliability in production still depends on building retries with exponential backoff for the rare transient error, which the benchmark methodology and our best-practices guide both recommend regardless of the provider you choose.
Sequential single-client throughput is roughly sixty divided by the median latency in seconds, so about 22 profile lookups per minute, 18 user-tweet pulls, and 14 advanced searches on one connection. Because the standard plan imposes no per-call rate limit, you raise throughput by running requests concurrently rather than waiting for each to finish. A pool of ten parallel workers multiplies the sequential figure by roughly ten, minus overhead, which is how large dataset pulls actually run in production.
Yes. The numbers here are full round-trip wall times from a single US client, so they include network round-trip time on top of server processing. A client physically closer to the API edge, or one inside a cloud region with a fast path to it, will see lower latency, while a client on a slow or distant connection will see higher. The server-side processing component is the part that differs by endpoint; the network component is the part that differs by your location.
In the benchmark, the profile endpoint (user/info) was fastest at roughly 2.7 seconds median, because it returns one object with no pagination. The user-tweets and followers endpoints sat around 3.3 to 4.0 seconds median, and advanced search was slowest at about 4.4 seconds median and 7.8 seconds at p95 because it does keyword matching and ranking server-side. If latency is critical for your use case, prefer point lookups over search where the data model allows it, and cache profiles you read repeatedly.
The official X API's Filtered Stream v2 carries an average latency of about five seconds per the X developer community, and it requires a paid tier and a developer account to access at all. A per-call read API returns a point lookup in roughly half that time with no streaming connection to maintain, no developer-account approval, and pay-per-call pricing. The trade-off is model rather than raw speed: streaming pushes data to you continuously, while a read API returns it when you poll, which for most monitoring and dataset use cases is the simpler and cheaper pattern.
No. The latency and reliability numbers here are first-party measurements of the GetXAPI production API only. Competitor figures cited in this post, such as the official X Filtered Stream's roughly five-second latency or twitterapi.io's claimed sub-second response, come from published sources and vendor or community statements, not from our own measurement. We label them as such throughout so the measured numbers and the cited numbers never get confused.
Check out similar blogs
More guides on the Twitter/X API, scraping, and pricing.

Twitter API 403 Forbidden and 401 Unauthorized: Every Cause and Fix
Why the X API returns 403 Forbidden or 401 Unauthorized, how to tell the two apart, and a fix for each cause. Covers tier gating, app permissions, OAuth, and X error codes.

The Best Twitter (X) API Alternatives in 2026, Compared
The best Twitter / X API alternatives in 2026, ranked and compared: managed pay-per-call APIs, web-data marketplaces, and open-source libraries, with real per-1,000-tweet costs.

How to Like a Tweet via API in 2026 (No Dev Account)
Like (favorite) tweets programmatically via API in 2026 without an X developer account. The auth_token model, working curl, Python, and Node code, and per-call cost.

Post Tweets via API With Authentication in 2026 (No Developer Account)
Post tweets, threads, and media through an API without an X developer account. The auth_token model, working Python and Node code, rate-limit safety, and per-call costs.

How to Get Notified When Someone Tweets on X (2026 Guide)
Get notified when someone tweets, in real time. Webhooks push every new post to your server, Slack, or a Discord bot. Keyword alerts, code, scale math, and costs.

How to Detect X (Twitter) Bots: A Practical, Data-Backed Method
A practitioner method for Twitter bot detection: the real signals (views-to-likes ratio, account age, posting cadence, follower pattern, amplification), runnable API code to pull each one, and a scoring rubric you own.

Scrape Full Tweet History of Any Account in 2026 (Beyond the 3,200 Limit)
Why the X timeline stops at 3,200 tweets and how to pull an account's full history with date-window search, cursor pagination, and dedup. Live-tested code in Python and curl.

Is the Twitter API Free in 2026? What the Free Tier Actually Gives You
The X API free tier is write only: 1,500 posts a month, zero read access. Here is the full 2026 cost ladder and where pay-per-call APIs fit for read-heavy work.